Turning Messy Sales Data Into Clear Decisions
Sales teams do not struggle because of a lack of data. They struggle because the data is scattered, confusing, and slow to help. As Q3 planning kicks in and pressure builds, most leaders want one thing: clear answers they can act on today. That is hard to get when every number seems to live in a different tool.
In this article, we will walk through why sales analytics feels so messy, what a modern sales analytics platform should actually do, and how integrated analytics inside a sales engagement platform can turn chaos into clarity before year-end targets are locked in. Our goal is simple: help you move from “I think” to “I know” when you make sales decisions.
Why Sales Analytics Feels So Chaotic Today
Many teams are buried under dashboards. There is the CRM report, then the email tool, then the dialer, then the call-recording app, then the forecasting spreadsheet, then the BI dashboard. Each one tells a small part of the story, but none of them show the full path from first touch to closed-won.
This leads to a few common problems:
- Too many tools, not enough clear signal
- Different definitions for the same metric
- Long delays answering simple questions
Sales ops teams often spend hours doing what we all jokingly call spreadsheet gymnastics. They pull CSV files, clean them, match fields, and then try to explain why a basic question, like “What is our conversion rate by segment?” takes so long to answer. By the time the answer is ready, the quarter has moved on.
There is also the problem of data without context. Leaders see activity totals, like how many emails were sent or how many calls were logged. But they cannot easily see which sequences, messages, or channels actually move deals into serious pipeline. Reps get told to “do more” instead of “do more of what works.” That is frustrating for everyone.
What a Modern Sales Analytics Platform Should Deliver
A modern sales analytics platform should quiet the noise, not add to it. The goal is to connect the dots between activity, engagement, pipeline, and revenue outcomes in one place. Instead of separate reports for email, phone, and social, you should see how all those touches combine to move deals forward.
There are three big things to look for:
- A unified view of the revenue engine
- Insights that tell each role what to do next
- Clear, consistent metrics everyone trusts
Unified view means you can follow a lead from first outbound touch, to first reply, to first meeting, to qualified opportunity, and finally to closed-won or closed-lost. When that lives in one platform, questions like “Which channel starts the best deals?” become simple, not a weekend project.
Insights you can act on are just as important. Reps should open their platform and see, in plain language, which prospects to focus on today. Managers should see which sequences are winning and which ones need coaching. Executives should see which segments create the most efficient growth, not just the biggest volume.
Finally, reliable metrics end the endless data debates. When everyone agrees on what counts as a qualified meeting, or how a stage-to-stage conversion is calculated, your forecast meetings get shorter and much more productive.
From Vanity Metrics to Revenue Intelligence
Most teams have a long list of activity metrics. Emails sent. Calls made. Meeting invites sent. These are fine, but on their own they do not tell you if you are really growing revenue. They are vanity metrics if they stop at volume.
A stronger sales analytics platform helps you shift focus to outcome-based metrics, like:
- Replies that turn into real meetings
- Meetings that create qualified opportunities
- Opportunities that consistently close
When you connect activity to pipeline quality, patterns start to show up. You might see that a shorter, direct email followed by a quick call works better than a long sequence with no human touch. Or that a mix of email and social messages gets more meetings with certain roles, especially when people are busy mid-year.
Simple visual views help here. Things like:
- Heat maps that show conversion rates by industry or region
- Cohort views that compare outbound sequences
- Win-rate trend lines that highlight where deals stall
The key is not fancy charts. The key is clarity. Non-technical leaders should be able to glance at a page and say, “We should double down on this segment” or “We should retire that sequence.” When analytics are that clear, teams act faster.
Bringing Analytics Into Daily Sales Workflow with Buzz AI
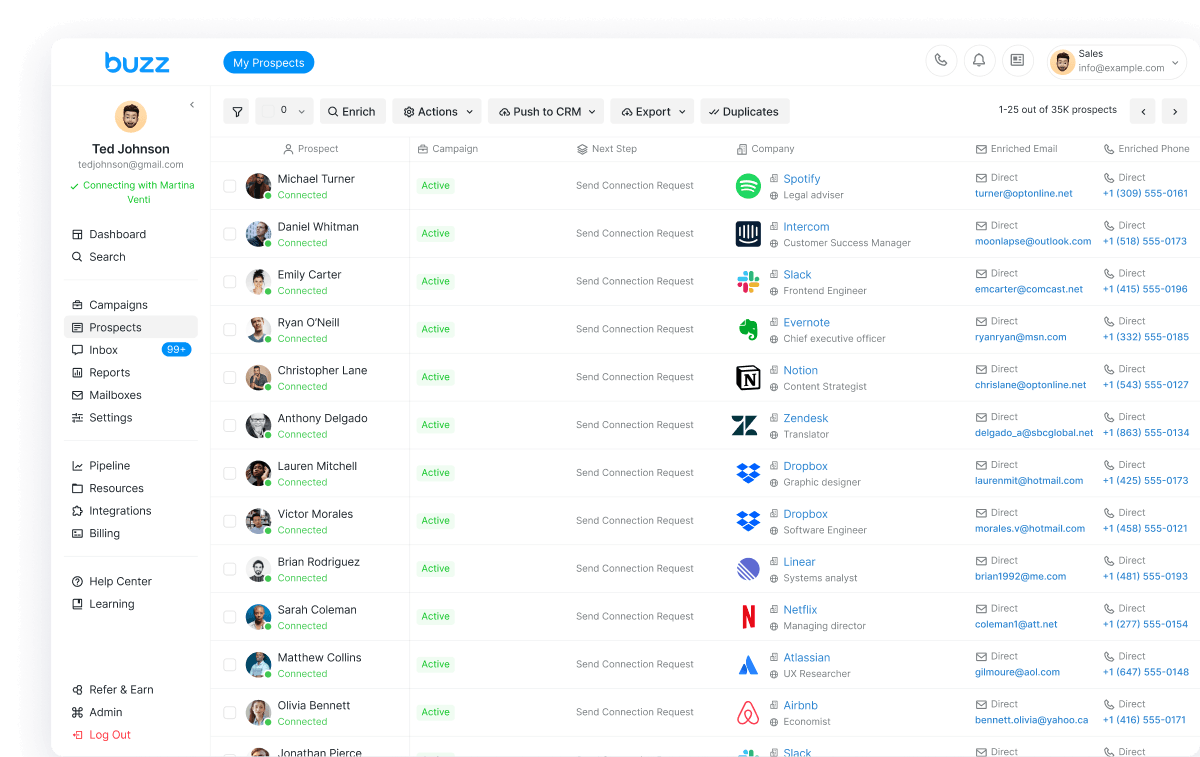
This is where integrated analytics really shine. Instead of asking reps to open a separate reporting tool, a platform like Buzz AI brings the data into the same place where outreach happens. That matters a lot when people are juggling email, phone, social messaging, and video touches during busy quarters.
With analytics inside daily workflows, reps can:
- See which sequences work best for similar accounts as they build campaigns
- Get live guidance on which prospects to prioritize today
- Learn which channels perform best at each stage of the deal
Because Buzz AI centralizes outreach across channels, teams get full-funnel visibility in one environment. You can see how a mix of email, calls, social, and video affects meeting rates, pipeline creation, and deal velocity without bouncing between tools.
Each role gets views that match how they work. Reps see prioritized lists and recommended next touches. Managers see coaching views by person, team, and sequence. Leadership sees pipeline and performance tied directly to real activities instead of only static CRM fields. That is how data stops being a chore and starts being a daily advantage.
A Simple Roadmap to Clean, Confident Sales Data
Moving from chaos to clarity does not have to be a giant project. It can start small, even as the weather heats up and teams are pushing to close business before the end of summer.
A simple roadmap looks like this:
- Pick a small set of core metrics to standardize
- Consolidate tools where the data pain is worst
- Build a regular rhythm around reviewing and acting on insights
First, get agreement on a few core metrics like qualified meetings, stage-to-stage conversion, and win rate. Make sure your tools and processes all support those definitions. Only then add more advanced metrics.
Next, reduce the number of point tools your team uses for outreach and enrichment. Bringing those activities into fewer platforms cuts down on data gaps and confusion. An all-in-one sales engagement platform with built-in analytics makes it much easier to trust your numbers.
Finally, turn insights into habits. Set weekly or monthly reviews where the team looks at one short, consistent analytics snapshot. Pick one or two changes to test, then review the impact at the next session. Over a couple of quarters, that rhythm turns scattered data into a clear, steady growth engine that everyone can understand.
Turn Your Sales Data Into Clear, Actionable Insights
Transform scattered metrics into a unified view of your pipeline with our sales analytics platform. At Buzz AI, we help you uncover which products, channels, and reps are really driving revenue so you can act with confidence. If you are ready to see how this could work for your team, reach out to contact us today.